
STATGRAPHICS Online – Ready for the 21st Century

 With STATGRAPHICS Online you have access to a comprehensive statistical software over the Internet or corporate intranet. Your advantage: a download or installation on your own PC is not required. All you need is a Web browser (eg Mozilla Firefox or Microsoft Internet Explorer). So you can access STATGRAPHICS from any computer, whether it’s running Windows, Mac or UNIX.
The content is similar to the online product, it’s big brother, STATGRAPHICS Centurion: the main statistical procedures are implemented. These include:
- Descriptive statistical methods,
- Comparison of two samples,
- Analysis of variance and regression,
- Process capability and
- Control charts which can be used both for normal and non-normal data, Weibull analysis and
- Time series analysis, including forecast models.
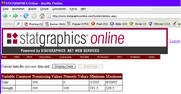
All calculations are processed through STATGRAPHICS. Net Web services , running on the remote server of the manufacturer StatPoint Inc.. The results come back in the HTML format, charts are embedded as a JPG image. Using Windows clipboard all the results can be copied to a target application. Analysis can be saved as XML script and can be run again later.
In a proven way you can set the various options for the calculations, result outputs are possible in different languages: German, English, French, Spanish, Italian, so that sharing of findings with partners in other countries is no problem. Of course, the StatAdvisor to interpret the results is available.
Open access is intended primarily for Students who can apply to deepen their knowledge in statistics courses, and without purchasing the software commercially. Commercial users have the opportunity to evaluate the program. Free access is limited to smaller data files (up to 10 files with 10 columns and 100 rows).
STAGRAPHICS Online – Features
- No download, no installation is required. The program runs in common web browsers. We recommend Mozilla Firefox or
- Microsoft Internet Explorer, as both browsers support client-side scripts that speed up data entry.
- The data is entered directly into the STATGRAPHICS sheet or inserted via the Windows clipboard or read from Excel, XML or text files.
- All calculations are procedured through STATGRAPHICS. Net Web Services on remote servers from StatPoint Inc.
- Results are returned in HTML format, charts are embedded as a jpg image. Using Windows clipboard all the results can be copied to a target application.
- The program interface is in English, results can be output in several languages: English, German, French, Spanish, Italian.
- Analysis can be saved as XML script and can be executed repeatedly at any time.
- In addition, a selection of Java applets (STATLETS ®) are provided that can be used for interactive data analysis.
Contact formular
We are happy to answer your questions. Leave your name, subject and an e-mail in the contact form so we can respond as quickly and accurately as possible.
Ihre Ansprechpartner
Ihre Ansprechpartner
für Versicherungsthemen, APL und Projekte
Axel Holzmüller
Alp Atayalp
Tel (0)212 / 2 60 66-50
Ihr Ansprechpartner
für Enterprise Software
Alp Atayalp
Tel (0)212 / 2 60 66-26
Allgemeine Fragen
richten Sie bitte an
projekte@dpc-software.de
Tel (0)212 / 2 60 66-0
fax +49 (0)212 / 2 60 66-66