
German Stata Conference
Friday, June 19, 2026 at Internationales Begegnungszentrum der Wissenschaft München e.V.
German Stata Conference 2026 – A Great Success in Munich
On June 18–19, 2026, the 23rd German Stata Conference brought the international Stata community together in Munich for two inspiring days of learning, exchange, and innovation. Researchers, data analysts, and professionals from academia, industry, and the public sector gathered to explore the latest developments in statistical analysis and data visualization with Stata.
With a strong focus on practical insights, methodological innovation, and networking, this year’s conference once again demonstrated why the German Stata Conference remains a key event for anyone working with data.
Workshop Highlight: Visualization with Stata
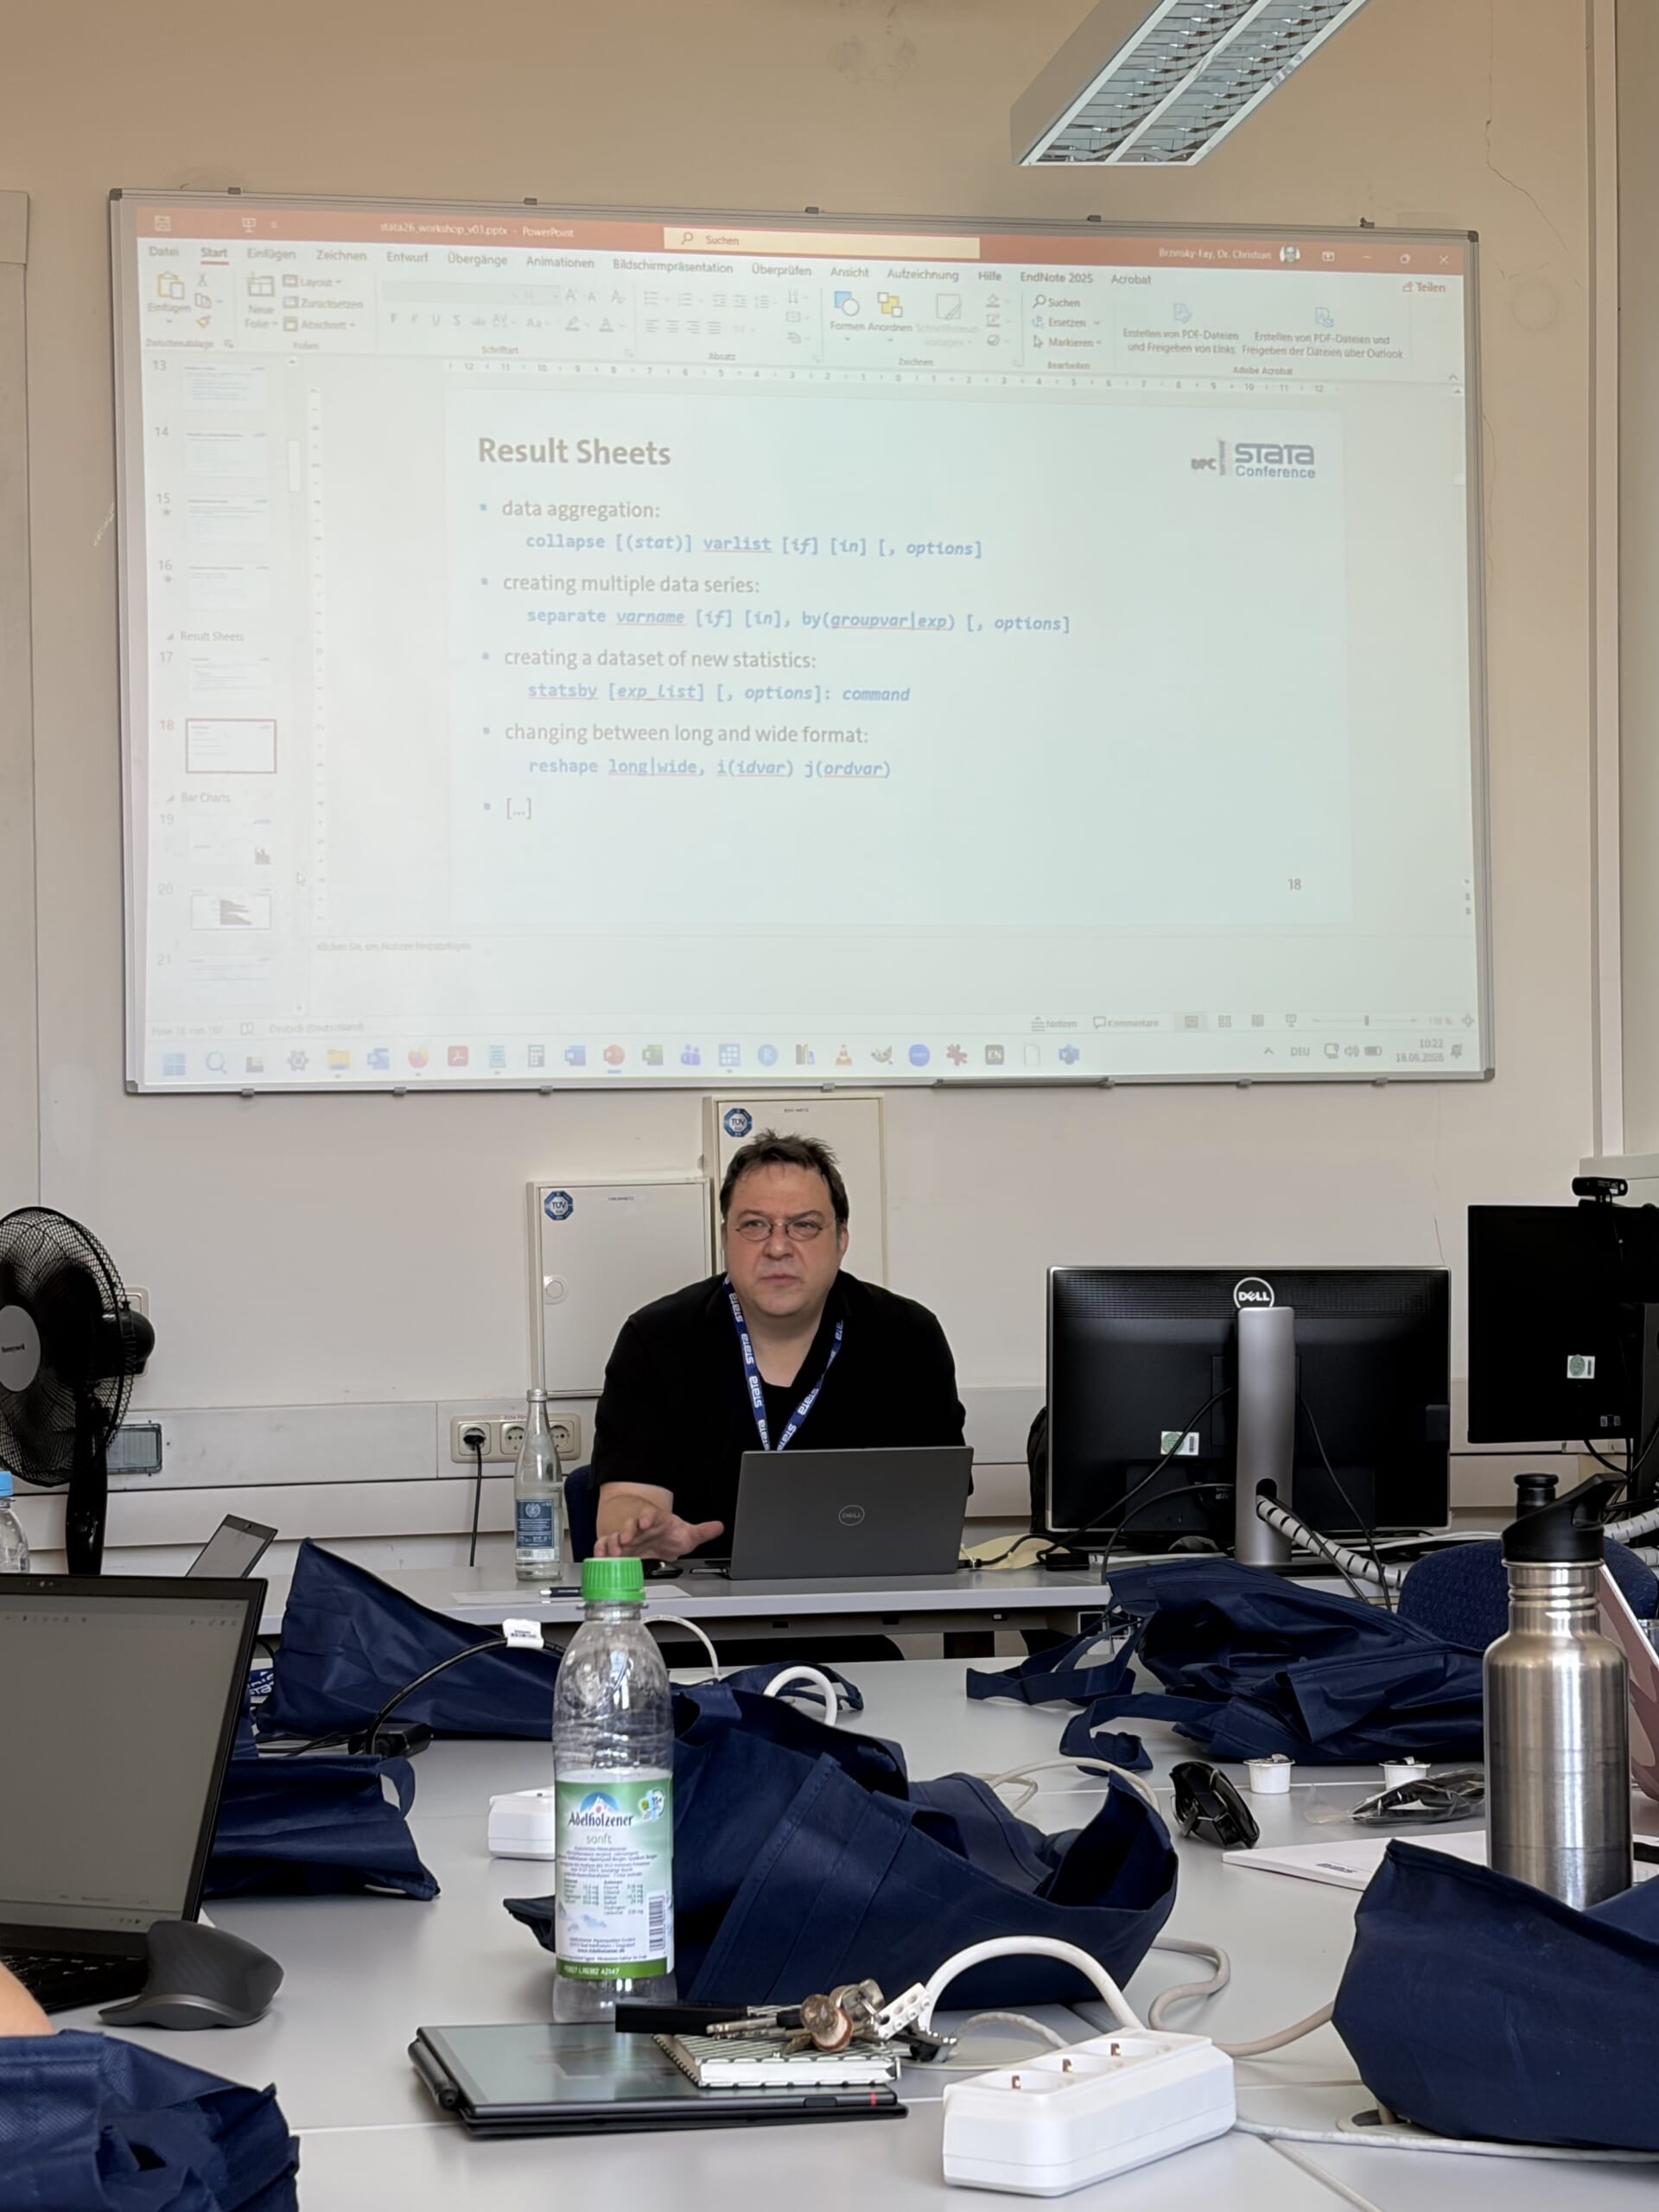
The event kicked off with a full-day workshop led by Dr. Christian Brzinsky-Fay, focusing on one of the most relevant topics in modern data analysis: effective data visualization.
Participants explored how to turn complex analytical results into clear, compelling visuals. The hands-on workshop provided practical techniques for:
- Creating publication-ready graphics in Stata
- Using AI Tools to Create Graphics
- Improving standard charts for better readability
- Avoiding common pitfalls in data presentation
- Communicating complex findings more effectively
The interactive format encouraged discussion, experimentation, and direct application—equipping participants with actionable skills they can immediately use in their daily work.
Keynote Highlight: Visualizing Relationships in Stata
A true highlight of the conference was the keynote by Dr. Asjad Naqvi (Austrian Institute for Economic Research).
In his talk “Visualizing relationships in Stata”, he addressed one of the key challenges in modern data science: making complex relational data understandable and insightful.
Using real-world examples such as trade flows, financial transactions, and migration data, Dr. Naqvi demonstrated how advanced visualization techniques can:
- Reveal hidden structures and patterns in data
- Highlight concentration and asymmetries
- Provide deeper insights into network relationships
- Transform complex datasets into intuitive visual stories
His presentation showed impressively how powerful visualization can bridge the gap between data and decision-making—turning analysis into impact.
A Diverse and High-Quality Program
Beyond the keynotes, the conference offered a rich program of presentations covering:
- Methodological advances and new Stata commands
- Practical applications from empirical research
- Innovative approaches to data analysis and modeling
This diversity ensured valuable takeaways for both experienced users and newcomers—making the conference a dynamic and engaging experience throughout the day.
More Than Just Content: A Strong Community
What makes the German Stata Conference special is not only the content—but the community behind it.
Participants exchanged ideas, discussed challenges, and built new connections across disciplines and countries, reinforcing the strong and growing Stata network.
Conclusion: Practical, Inspiring, Future-Oriented
The 23rd German Stata Conference 2026 was a great success—combining:
- Hands-on learning
- High-level expertise
- International exchange
- Immediate practical relevance
A big thank you to all speakers, participants, and partners who made this event possible.
We look forward to seeing you at the next German Stata Conference!
German Stata Conference 2026 – Ein großer Erfolg in München
Am 18. und 19. Juni 2026 brachte die 23. German Stata Conference die internationale Stata-Community in München für zwei inspirierende Tage voller Lernen, Austausch und Innovation zusammen. Forschende, Datenanalysten sowie Fachleute aus Wissenschaft, Wirtschaft und dem öffentlichen Sektor nutzten die Gelegenheit, um sich über die neuesten Entwicklungen in der statistischen Analyse und Datenvisualisierung mit Stata zu informieren.
Mit einem starken Fokus auf praxisnahe Einblicke, methodische Innovationen und Networking zeigte die diesjährige Konferenz erneut, warum die German Stata Conference ein zentrales Event für alle ist, die mit Daten arbeiten.
Workshop-Highlight: Datenvisualisierung mit Stata
Die Veranstaltung begann mit einem ganztägigen Workshop unter der Leitung von Dr. Christian Brzinsky-Fay. Im Mittelpunkt stand eines der wichtigsten Themen moderner Datenanalyse: effektive Datenvisualisierung.
Die Teilnehmenden lernten, wie sich komplexe Analyseergebnisse in klare und überzeugende Visualisierungen umwandeln lassen. Der praxisorientierte Workshop vermittelte unter anderem:
- Erstellung publikationsreifer Grafiken in Stata
- Nutzung von KI-Tools bei der Erstellung von Grafiken
- Verbesserung standardmäßiger Diagramme für bessere Lesbarkeit
- Vermeidung typischer Fehler bei der Datenpräsentation
- Verständliche Kommunikation komplexer Ergebnisse
Das interaktive Format förderte Diskussionen, Ausprobieren und direkte Anwendung – und gab den Teilnehmenden Werkzeuge an die Hand, die sie sofort im Arbeitsalltag einsetzen können.
Keynote-Highlight: Beziehungen in Daten visualisieren
Ein besonderes Highlight der Konferenz war die Keynote von Dr. Asjad Naqvi (Österreichisches Institut für Wirtschaftsforschung).
In seinem Vortrag „Visualizing relationships in Stata“ ging er eines der zentralen Probleme moderner Datenanalyse an: komplexe Zusammenhänge verständlich und aussagekräftig darzustellen.
Anhand praxisnaher Beispiele wie Handelsströmen, Finanztransaktionen und Migrationsdaten zeigte Dr. Naqvi, wie fortgeschrittene Visualisierungstechniken dabei helfen können:
- verborgene Strukturen und Muster sichtbar zu machen
- Konzentrationen und Ungleichgewichte zu erkennen
- tiefere Einblicke in Netzwerke und Beziehungen zu gewinnen
- komplexe Datensätze in intuitive visuelle Geschichten zu übersetzen
Sein Vortrag machte eindrucksvoll deutlich, wie leistungsstarke Visualisierung die Lücke zwischen Datenanalyse und Entscheidungsfindung schließen kann.
Ein vielfältiges und hochwertiges Programm
Neben den Keynotes bot die Konferenz ein abwechslungsreiches Programm mit Vorträgen zu:
- methodischen Weiterentwicklungen und neuen Stata-Kommandos
- praxisnahen Anwendungen aus der empirischen Forschung
- innovativen Ansätzen in Datenanalyse und Modellierung
Diese Vielfalt sorgte dafür, dass sowohl erfahrene Anwender als auch Einsteiger wertvolle Erkenntnisse gewinnen konnten – und machte die Konferenz durchgehend spannend und lebendig.
Mehr als Inhalte: Eine starke Community
Was die German Stata Conference besonders macht, ist nicht nur das Programm, sondern auch die Community dahinter.
Die Teilnehmenden tauschten Ideen aus, diskutierten Herausforderungen und knüpften neue Kontakte über Fachbereiche und Länder hinweg – und stärkten damit das stetig wachsende Stata-Netzwerk.
Fazit: Praxisnah, inspirierend und zukunftsorientiert
Die 23. German Stata Conference 2026 war ein voller Erfolg und vereinte:
- praxisnahes Lernen
- hohe fachliche Expertise
- internationalen Austausch
- direkte Relevanz für den Arbeitsalltag
Ein großes Dankeschön an alle Vortragenden, Teilnehmenden und Partner, die dieses Event möglich gemacht haben.
Wir freuen uns darauf, Sie bei der nächsten German Stata Conference wiederzusehen


Conference Speaker

Key Note Speaker
Dr. Asjad Naqvi
(Austrian Institute for Economic Research) presents:
Visualizing relationships in Stata

Key Note Speaker
Philippe van Kerm
(University of Luxembourg) presents:
Shapley value calculations: Implementation and illustrations

Stata Speaker
Meghan Cain
(StataCorp LLC.) presents: Psychometric meta-analysis
Visualizing relationships in Stata | Asjad Naqvi
Abstract: When working with flow data in Stata, such as trade, financial transactions, or migration, we often encounter limitations in visualizing network structures. To address these challenges, this presentation introduces and showcases a set of tools for working with relational data in Stata. These tools can enable users to visualize and communicate metrics such as concentration, asymmetries, and other structural patterns embedded in flow relationships.
drlate: Doubly Robust and Covariate-Balancing Estimation of LATE in Stata | Derya Uysal
Derya Uysal (LMU Munich), Tymon Sloczyński (Brandeis University), and Jeffrey M. Wooldridge (Michigan State University)
Abstract: We introduce drlate, a new Stata command for estimating local average treat ment effects (LATE) and local average treatment effects for the treated (LATT) using doubly robust and covariate- balancing methods. The command complements Stata’s lateffects by expanding the set of available estimators and improving inference.
drlate implements regression adjustment, inverse probability weighting (IPW), IPWRA, AIPW, and normalized versions of IPW and AIPW estimators. Outcomes may be continuous, binary, or count. The treatment is binary (with extensions to continuous treatments under development), and the instrument is binary.
The instrument propensity score can be estimated either by maximum likelihood or by method-of-moments approaches that directly balance covariates. We implement covariate balancing propensity scores (Imai and Ratkovic, 2014) and inverse probability tilting (Graham, Pinto, and Egel, 2012, 2016) as covariate-balancing alternatives to likelihood based estimation.
In addition, we provide testing procedures for equality of LATE and LATT and for comparisons between LATE and both linear and nonlinear IV estimators. We also address an issue in the standard error calculation of lateffects and provide consistent variance estimation for all implemented estimators.
classify: Over two hundred measures of association, correlation and forecast accuracy for categorical outcomes | Andrei Sirchenko
Andrei Sirchenko (Nyenrode Business University)
Abstract: We describe a new Stata command classify that computes various measures of association and correlation between two categorical variables (dichotomous and polytomous, nominal and ordinal), diagnostic scores of probabilistic forecasts of such variables, and various measures of the accuracy of deterministic forecasts of them. We compiled a comprehensive catalogue of over 200 measures of association, correlation and forecast verification and diagnostic scores for probabilistic forecasts from different fields, along with the terminological synonymy and bibliography associated with them. In addition to the overall measures, the command computes the class-specific metrics as well as their macro and weighted averages.
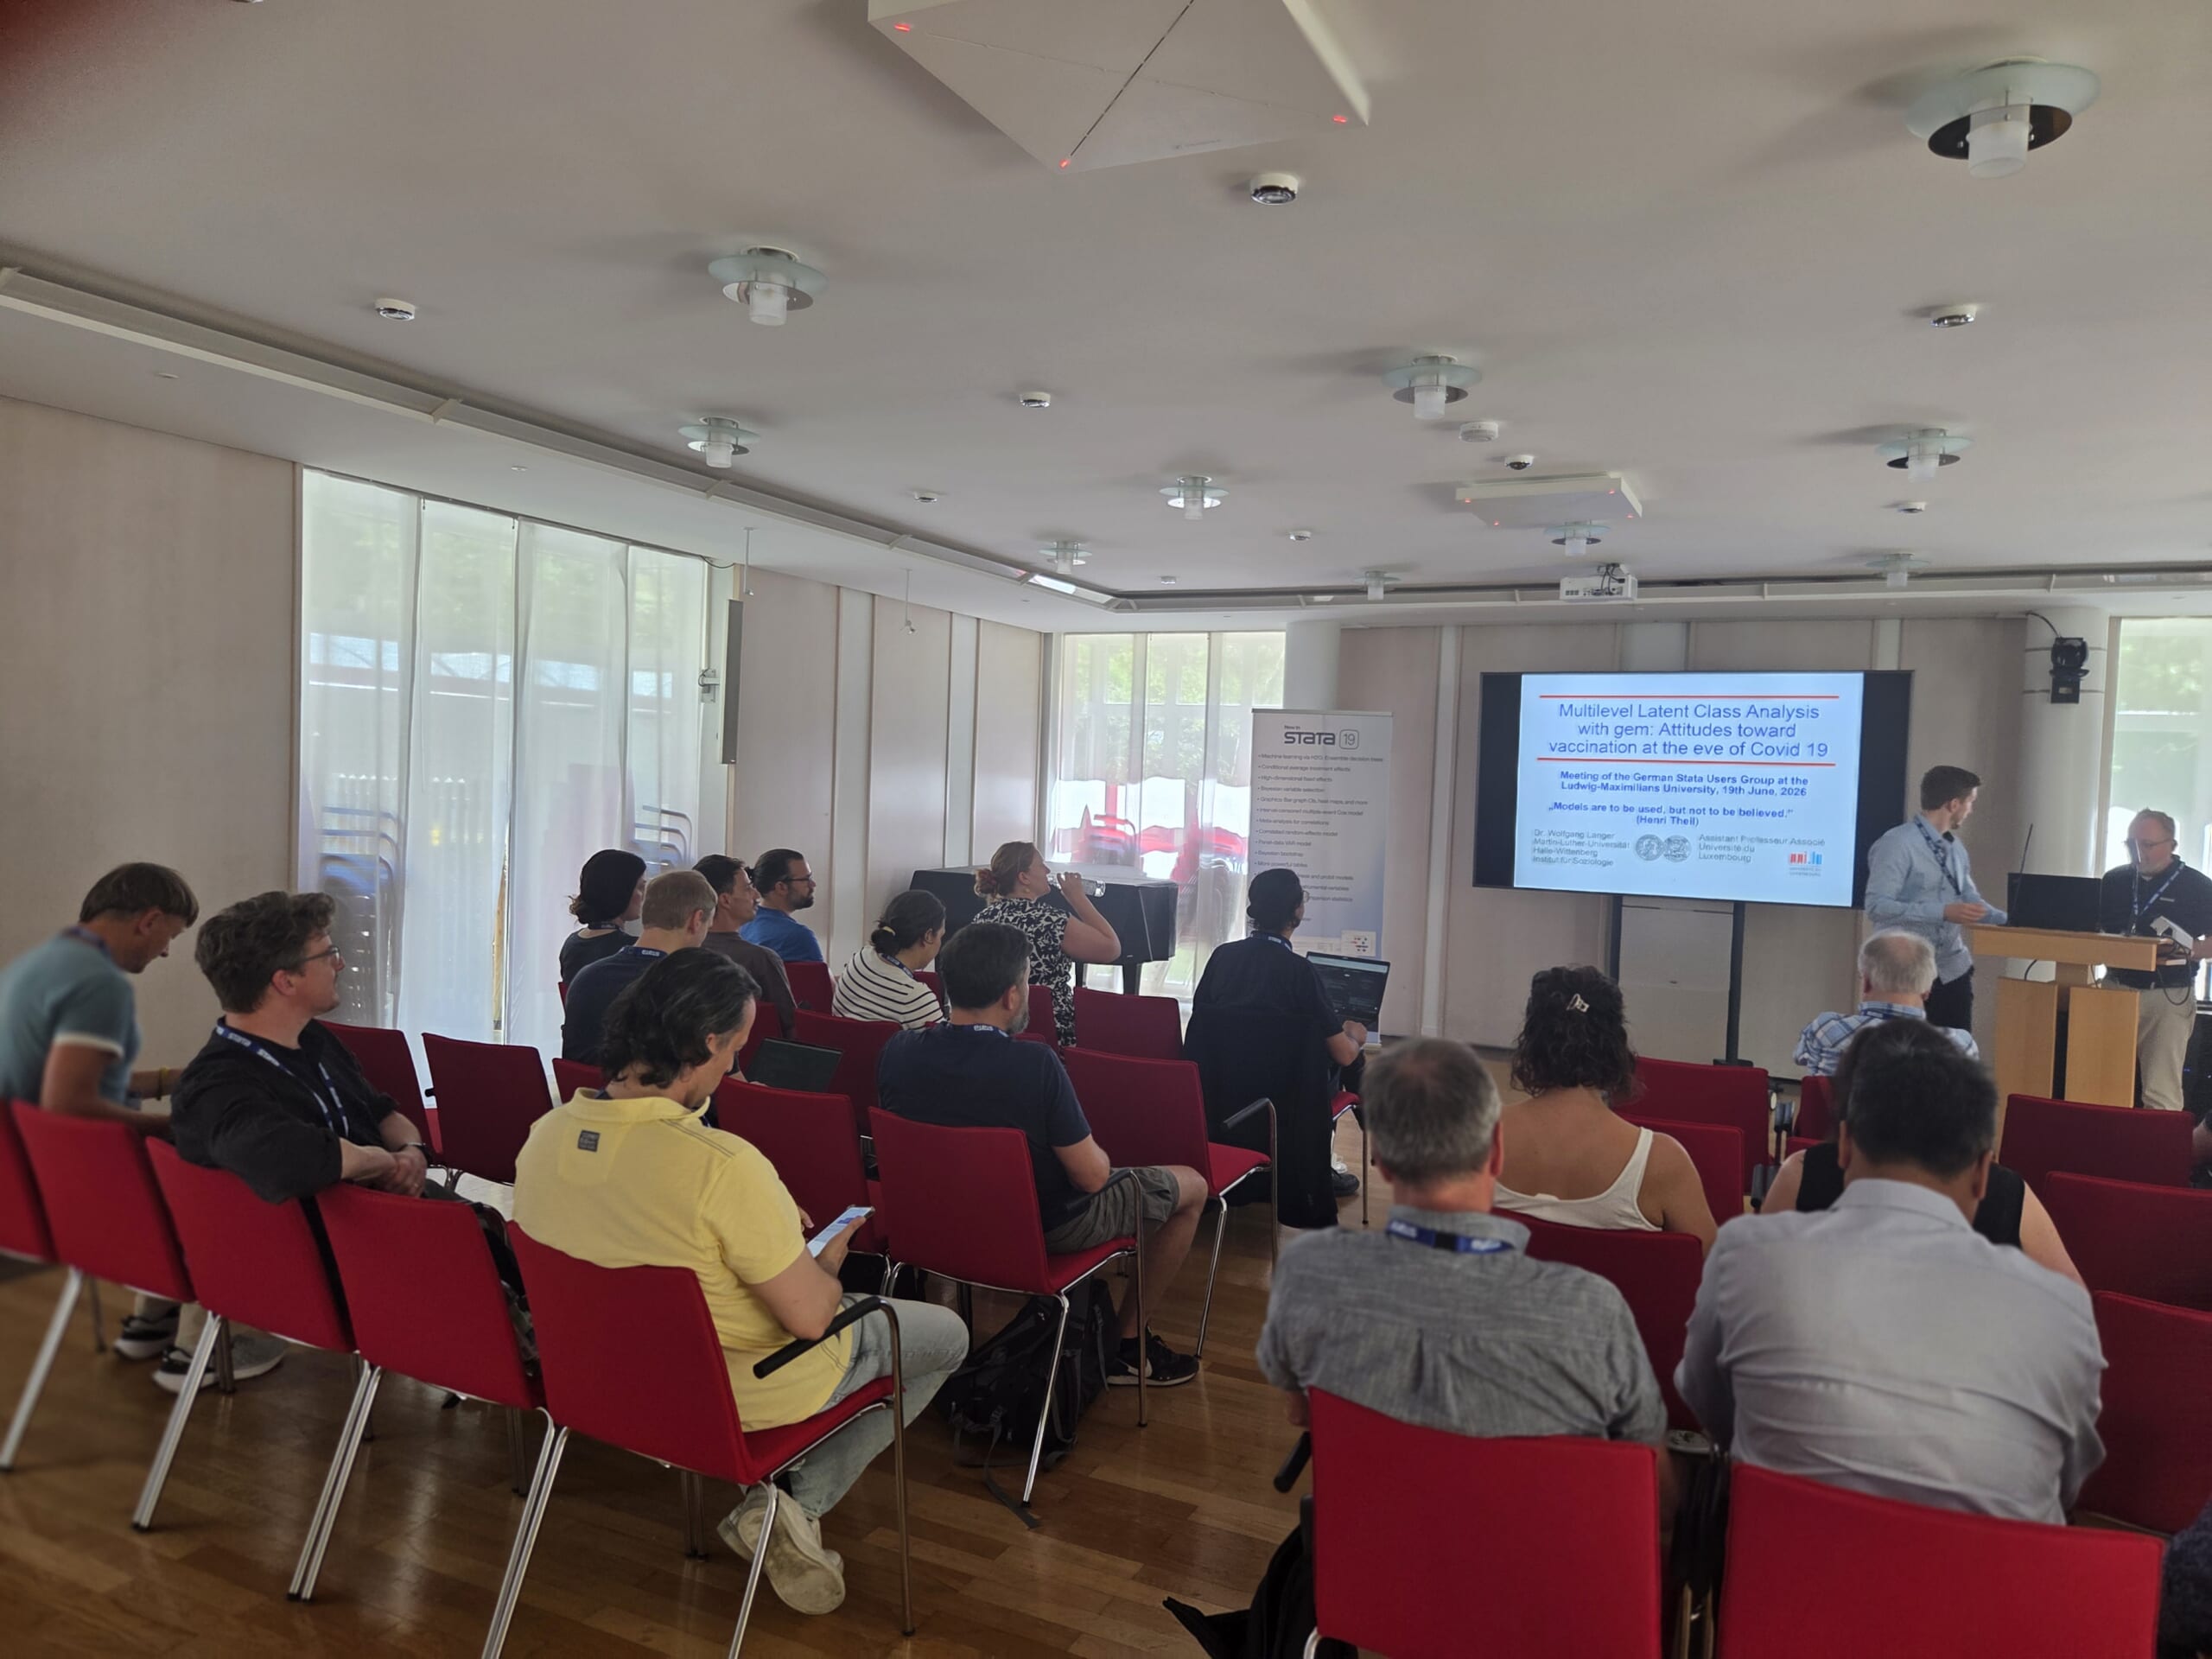
Multilevel-Latent-Class Analysis with gsem | Wolfgang Langer
Abstract: Since version 15 Stata offers the possibility to estimate Latent Class Models for categorical observed indicators being dichotomous, ordinal or nominal. It also integrates manifest covariates to predict the class membership of the observations. Both parts of the model, the measurement one and the prediction one, are estimated simultaneously, so that changes in the measurement part influence the estimates of the structural part and vice versa. According to Hayduk (1996) and Bakk & Kuha (2020) I propose a 3 steps approach. Firstly I estimate a sequence of Latent Class Models identifying the most appropriate solution by the entropy criteria. Secondly I analyze profile plot of the item probabilities to attach meaningful labels to the latent classes. The assignment of observations to the discrete latent classes follows the highest probability rule. Thirdly I estimate a multinomial logit regression model to predict the discrete latent class membership by exogenous level 1 and level 2 variables. To estimate a logistic intercept-as-outcome model I use the Stata xtmlogit command introduced by version 17. I demonstrate the usefulness of this approach presenting a latent class analysis of attitudes towards vaccination at the eve of the Covid 19 pandemia using the Special Eurobarometer 488 data set. Being a vaccination supporter, a conspirator or a naif is predicted within 28 European countries by the personal characteristics of the respondents and between countries by their fixed effect dummy variables. To enlighten these black boxes I estimate a random-effect intercept-as-outcome multinomial logit model with the xtmlogit command using exogenous level 2 variables like collective level of trust in government, gdp, poverty rate and the Global Health Security Index in addition. Finally I discuss the
main results and give some methodological considerations.
Shapley value calculations: Implementation and illustrations | Philippe van Kerm
Abstract:This presentation will introduce and illustrate the use of the Shapley–Owen value in an array of applications. It will first introduce the concept of the Shapley value and the related concept of Owen value. It will then describe the ’shapowen‘ package, a generic calculator for the Shapley-Owen value. A range of examples will then show the practical implementation of the Shapley-Owen value in regression analysis and will illustrate a range of possible alternative uses of the Shapley-Owen drawn from income distribution research.
crosswalk: A command for fast and flexible bulk recoding | Ben Jann
Abstract: In this talk I will present the crosswalk command, a data management utility for fast table-based recoding. The command comes with predefined crosswalk tables for common recoding tasks related to occupational classifications, e.g. to translate ISCO codes (International Standard Classification of Occupations) into ISEI scores (International Socio-economic Index of Occupational Status), OEP scores (Occupational Earning Potential), or ESeC classes (European Socio-economic Classification). However, it is also easy to define, manipulate, and apply custom recoding tables. In the talk I will briefly explain how crosswalk is implemented, present its syntax, and then illustrate its use with some applied examples.
Matching, weighting, or regression? Evidence from a comprehensive simulation study of Stata treatment effect estimators| Felix Bittmann
Abstract: Estimating treatment effects with cross-sectional data is one of the most widespread approaches in empirical research. Provided that researchers are able to measure all relevant control variables, it is possible to approximate unbiased (causal) treatment effects. To this end, Stata offers a wide range of standard and user-written commands. Naturally, the question remains which of these methods is most robust for producing unbiased point estimates and valid inference. We address this question by evaluating 14 different commands in a comprehensive simulation study. Using four different settings (unbiased, biased, incorrect functional form, heterogeneous treatment effects), we analyze a variety of empirically relevant scenarios. Our results indicate that linear (OLS) regression exhibits the lowest bias, the smallest standard errors, and the most accurate coverage in almost all simulation specifications. Entropy balancing and some matching approaches offer advantages when nonlinearities are incorrectly specified. When heterogeneous treatment effects are present, regression adjustment or AIPW approaches deliver the best results. Surprisingly, several methods deviate substantially from the target estimands, even in unbiased “best-case” scenarios.
New functionality in blockops, a Mata library for efficient operations on block matrices | Daniel C. Schneider
Abstract: In Schneider (2025), a new Mata library called blockops was introduced. The library serves two main purposes. First, it provides a simple approach for working with a particular class of sparse matrices: Submatrices consisting entirely of zeros are represented by null pointers and are excluded from arithmetic operations. Second, it allows the application of built-in, (official) Mata library, or user-defined functions to each submatrix, in a manner similar to, for example, R’s apply() family of functions. This presentation revisits the core ideas underlying blockops and then outlines recent developments. Key efficiency concerns have been addressed, and numerous new methods have been added to the library’s central object, which represents a block matrix. The practical usefulness of the extended functionality is illustrated through several examples.
Psychometric meta-analysis | Meghan Cain
Meghan Cain (StataCorp LLC.)
Abstract: This talk introduces meta psycorr, a new command in StataNow for psychometric meta-analysis. Psychometric meta-analysis provides a more rigorous framework than traditional meta-analysis by correcting for statistical artifacts—including measurement error, range restriction, artificial dichotomization, and small-study bias. In this talk, we will introduce the theory and then demonstrate a practical Stata workflow. We
will also generate corrected forest plots and explore heterogeneity using Stata’s integrated meta suite.
Open panel discussion with Stata developers
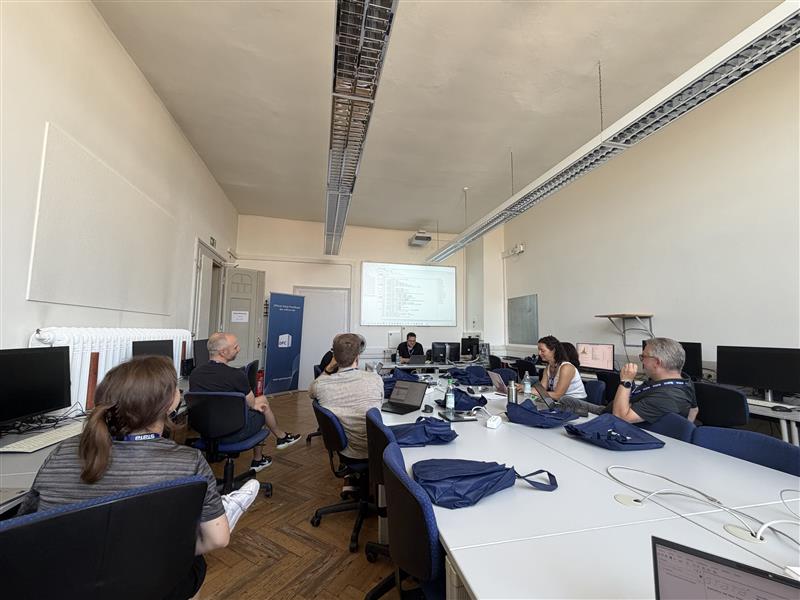
Workshop Visualization with Stata
Presenter: Dr. Christian Brzinsky-Fay
The importance of visual communication increases not only on social media but also in research. It is therefore crucial to encode your results in graphs and diagrams in an appropriate way that allows readers a correct decoding of information. Stata provides publication-ready graphs with an endless number of modifications. Unfortunately, preparing scientific publications is usually a time-critical process, and researchers often don’t have enough time to invest in perfect graphs.
The workshop addresses students and scientists of different levels of knowledge. We will deal with issues of efficient graph construction, i.e. how to systematically create colourful graphs that can be intuitively understood by readers. We will also talk about graph manipulation and a couple of tricks which are not part of the documentation. During the workshop, I will also introduce some helpful user-written ados with respect to graph construction.
Scientific Organizers
Johannes Giesecke
Humboldt University Berlin
johannes.giesecke@hu-berlin.de
Ulrich Kohler
University of Potsdam
ulrich.kohler@uni-potsdam.de
Christian Ganser
LMU Munich
christian.ganser@lmu.de
Daniel Krähmer
LMU Munich
daniel.kraehmer@soziologie.uni-muenchen.de
Logistics Organizer
DPC Software GmbH
Official Stata Distributor in Germany, the Netherlands, Austria, Czechia and Hungary.
You can enroll here or by contacting Tim Prenzel by email, by writing or phoning.
Tim Prenzel
DPC Software GmbH
Phone: +49-212-224716 -15
E-Mail: Tim.Prenzel@dpc-software.de