
German Stata Conference 2024 – Report
Friday, June 7, 2024 at GESIS – Leibniz Institute for the Social Sciences in Mannheim
Report German Stata Conference 2024
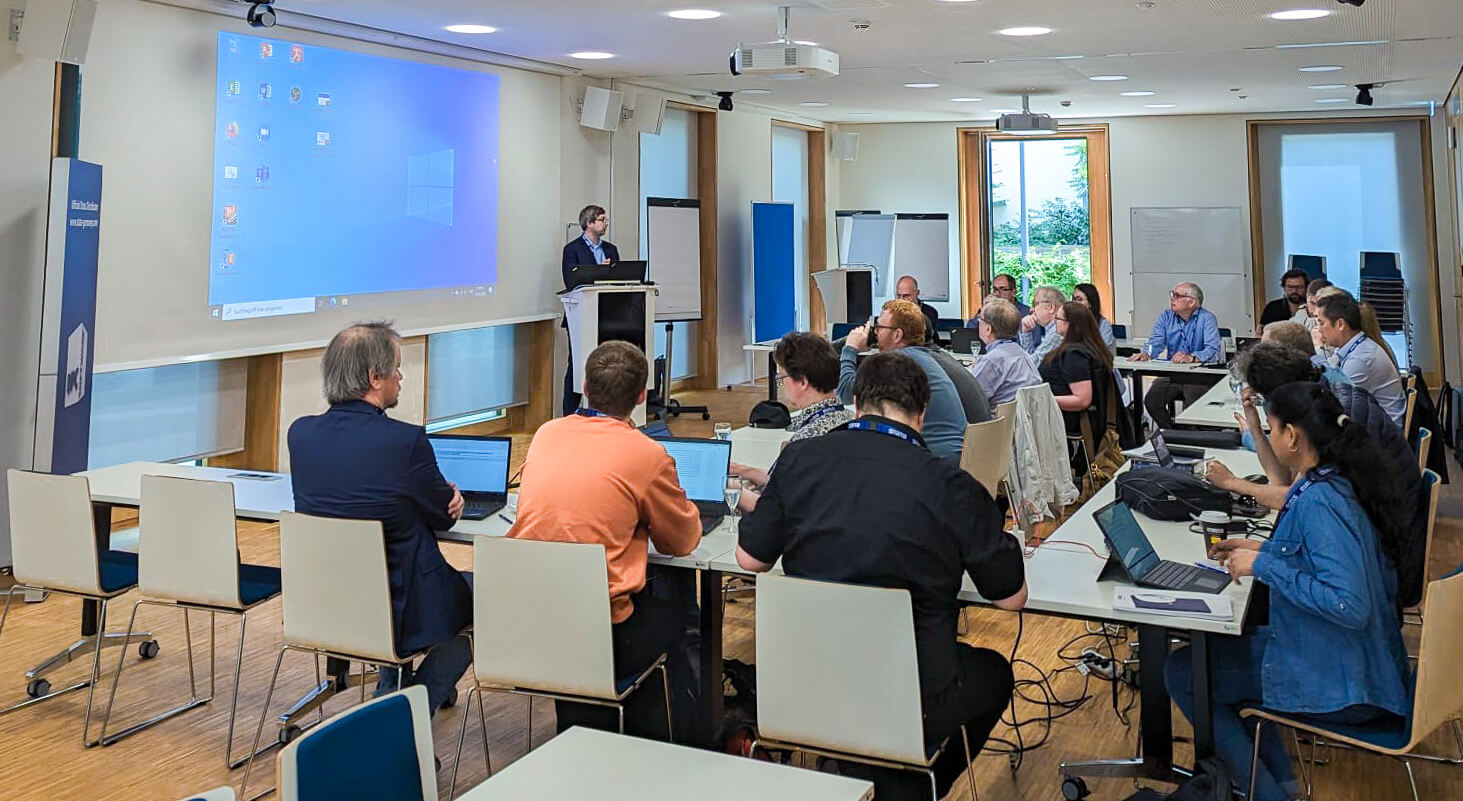
This year’s German Stata Conference was held on June 7th/8th at GESIS Leibniz Institute for the Social Sciences in Mannheim.
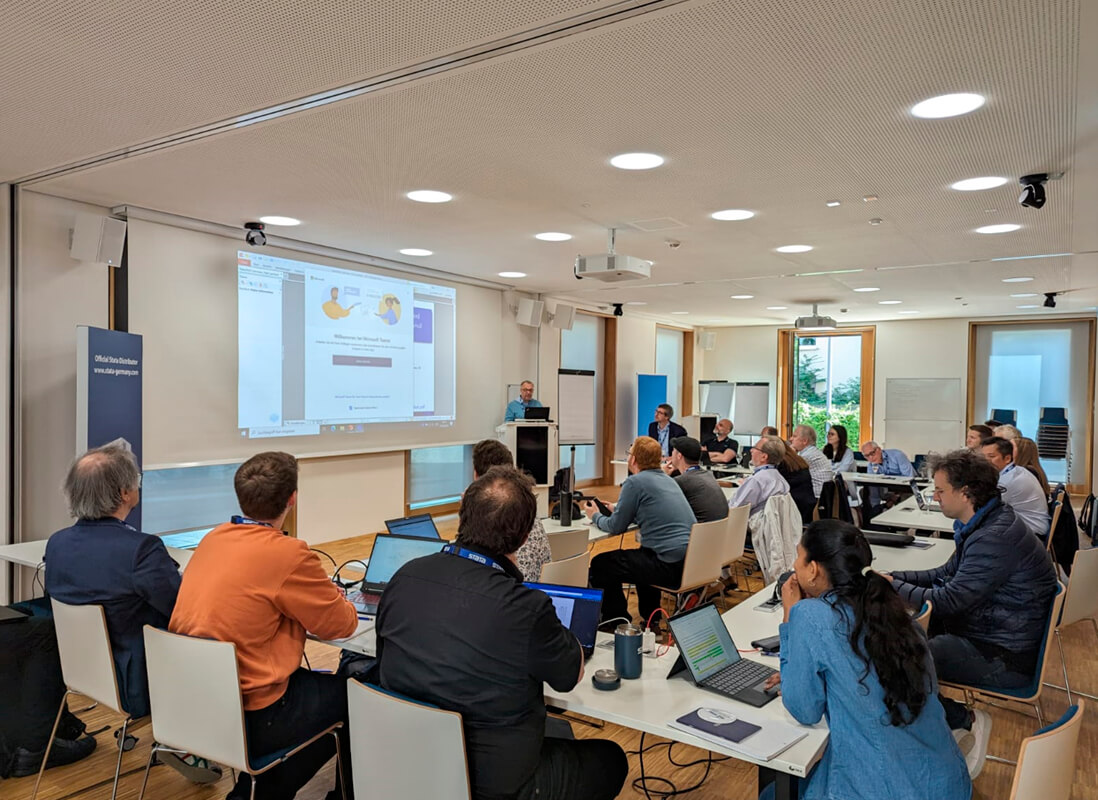
Prof. Reinhard Pollack, head of department data and research on society hosted this conference, while the DPC team was responsible for the organization. GESIS is one of the largest research institutions in Europe providing data infrastructure in the Social Sciences and therefore a perfect partner for Stata. Prof. Johannes Giesecke (Humboldt University Berlin) and Prof. Ulrich Kohler (University of Potsdam) served as the scientific committee. As representatives of Stata Corp. we had the pleasure to have Kristin MacDonald and Chinh Nguyen as guests. The DPC team and the conference participants have used the chance to discuss a couple of issues around Stata with its developers in person.
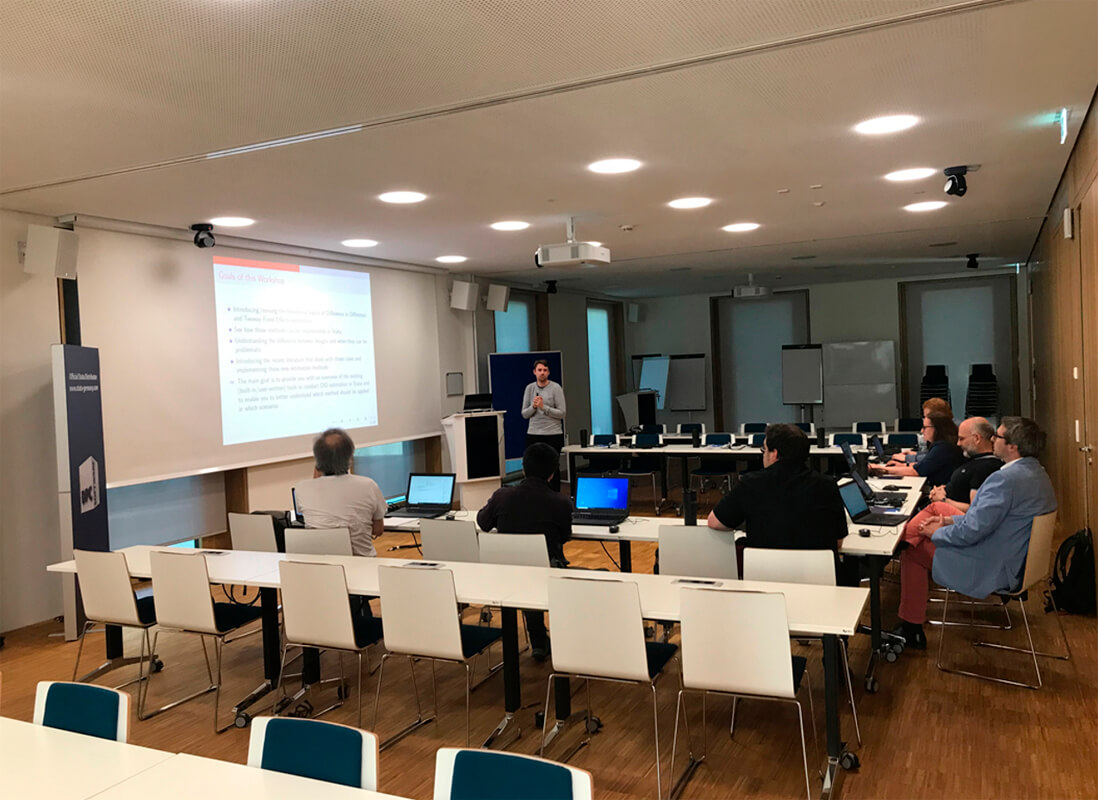
On Thursday, we had a very good pre-conference workshop on difference-in-difference (DiD) estimation, in which Felix Knauf from Science Po in Paris presented newest and most recent developments of this methods. As an expert in the field he developed together with colleagues a couple of user-written ados, which he explained in detail in his 7-hour workshop. Participants had the chance to conduct hands-on sessions and discuss specific issues with Felix in detail. He covered the theoretical basis of the method, different DiD-approaches and -designs as well as recent papers that further develops the method. Felix also provided a couple of web-based resources to DiD estimation.
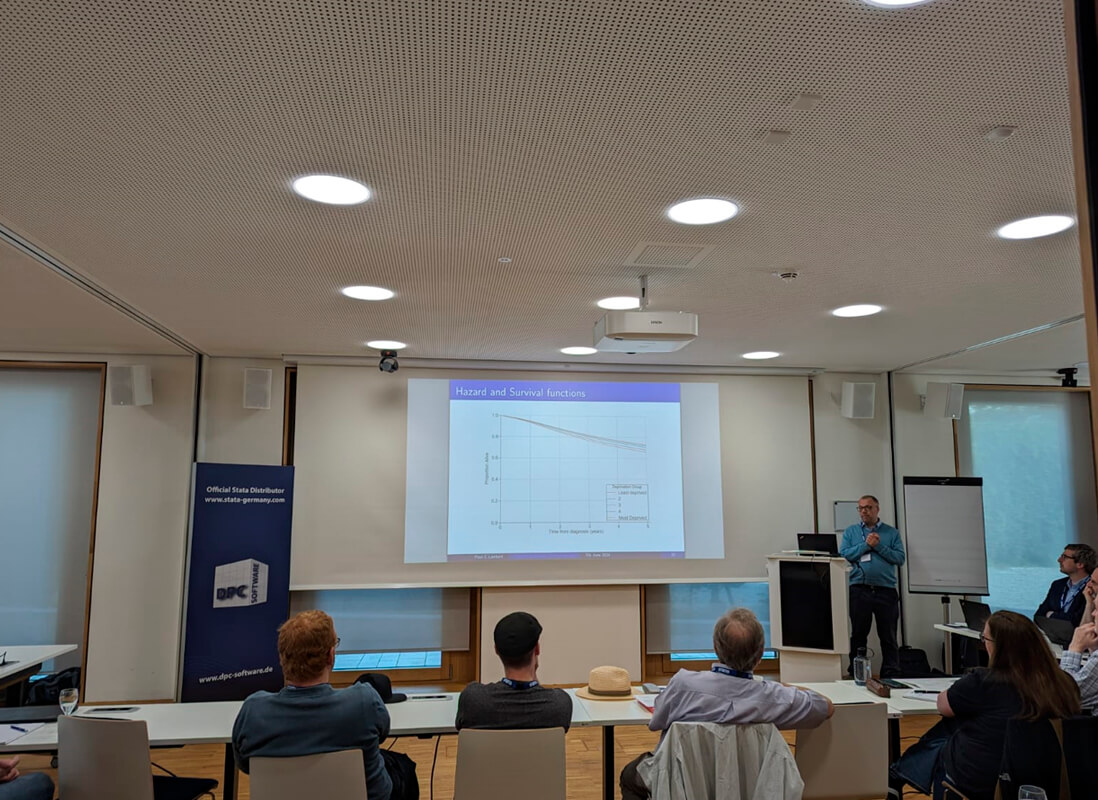
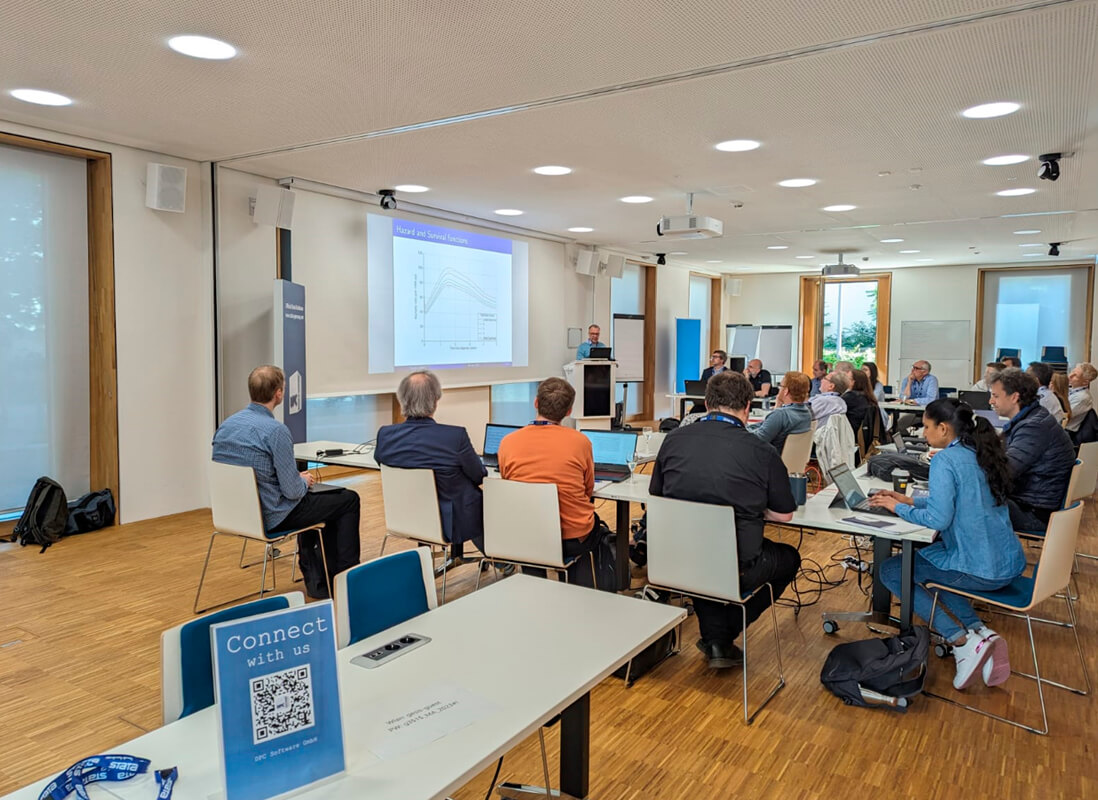
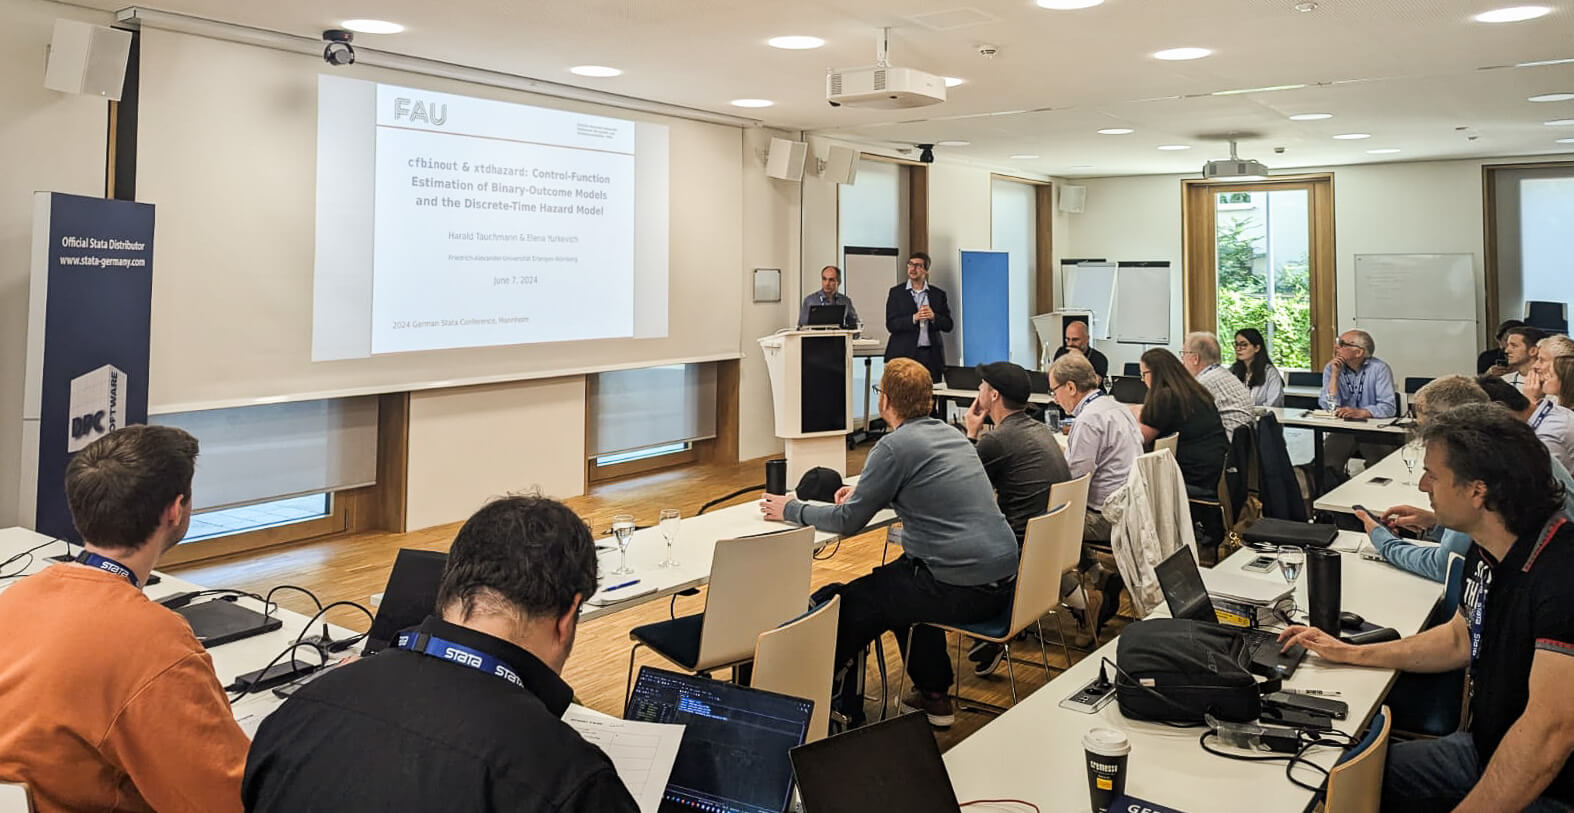
The conference started on Friday with a presentation of GESIS by Prof. Pollack, followed by the keynote of Prof. Paul Lambert (University of Leicester and Karolinska Institutet Stockholm) on survival analysis (aka event history models). He argued for flexible parametric survival models as an alternative to the ‚gold standard‘ of the Cox proportional hazards model. In that context, he presented his user-written ado ’stpm3′ and a couple of postestimation tools. Also related to survival analysis was the second presentation by Prof. Harald Tauchmann (Friedrich-Alexander-University of Erlangen-Nurenberg), where he presented his user-written ados ‚cfbinout‘ and ‚xtdhazard‘. Both presentations represent most recent discussions in the field of survival analysis.
The last two presentations before the lunch break were given by Peter Krause (DIW Berlin) on multidimensional well-being, deprivation, and inequality and by Wolfgang Langer (Martin-Luther-University Halle-Wittenberg) on model fit statistics of logistic regression models. He developed an own program that is able to calculate different pseudo-r-squared statistics in order to asses the goodness of fit of these non-linear models. This presentation was followed by a fruitful and controversial discussion on the validity of the different measures, because a community-wide accepted standard has not agreed upon yet. The user-written ado ‚fit_cmlogit‘ contributes to the ongoing debate on how to assess the goodness of fit for logistic regression models.
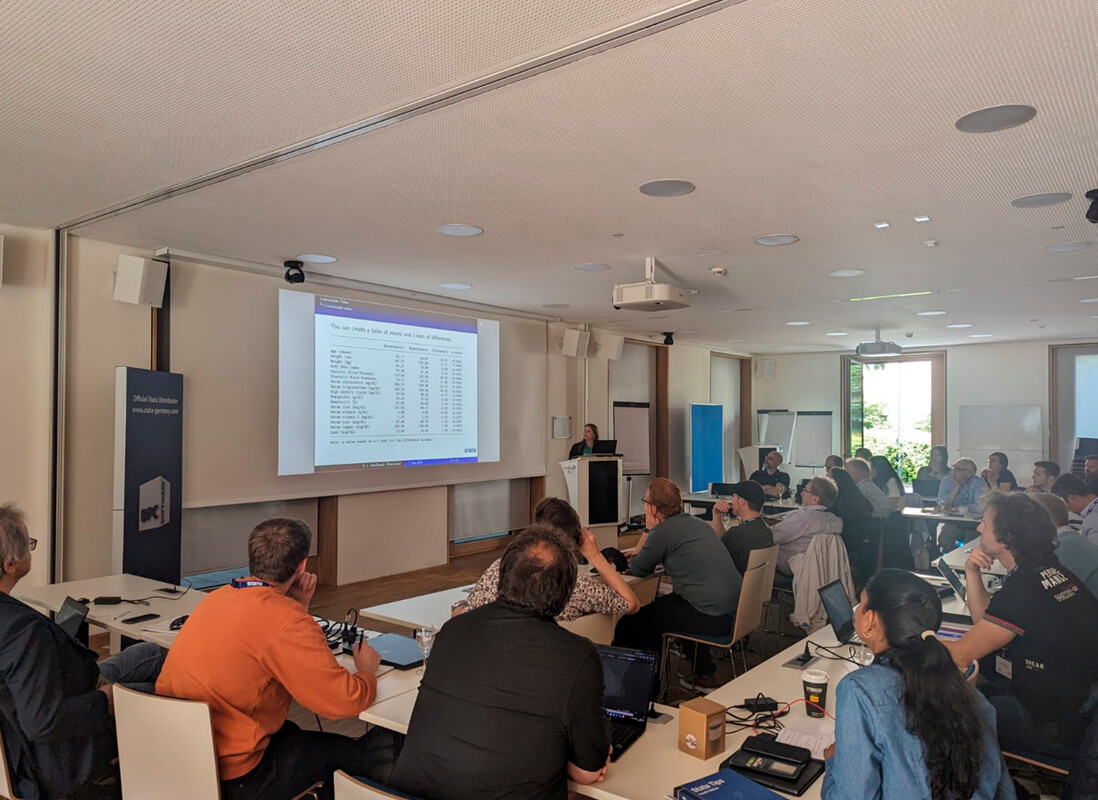
After the lunch break Kristin Macdonald from Stata Corp. presented Stata’s recent commands for customizing tables, namely the renewed table-command, etable and dtable. Those are wrappers to the new and very elaborated collect suite that allows to pile up a collection of statistical tables, which can be modified according to individual needs and exported to MS Word, Excel, HTML, LaTeX or pdf format. The export of tables from Stata into other formats was an obstacle for many years and has led to a couple of user-written ados, such as estab or estout. The implementation of the rather complex collect suite and the more accessible wrappers table, dtable and etable has filled a gap in Stata’s command universe and will clearly facilitate the construction and export of tables from Stata to Word processing software.
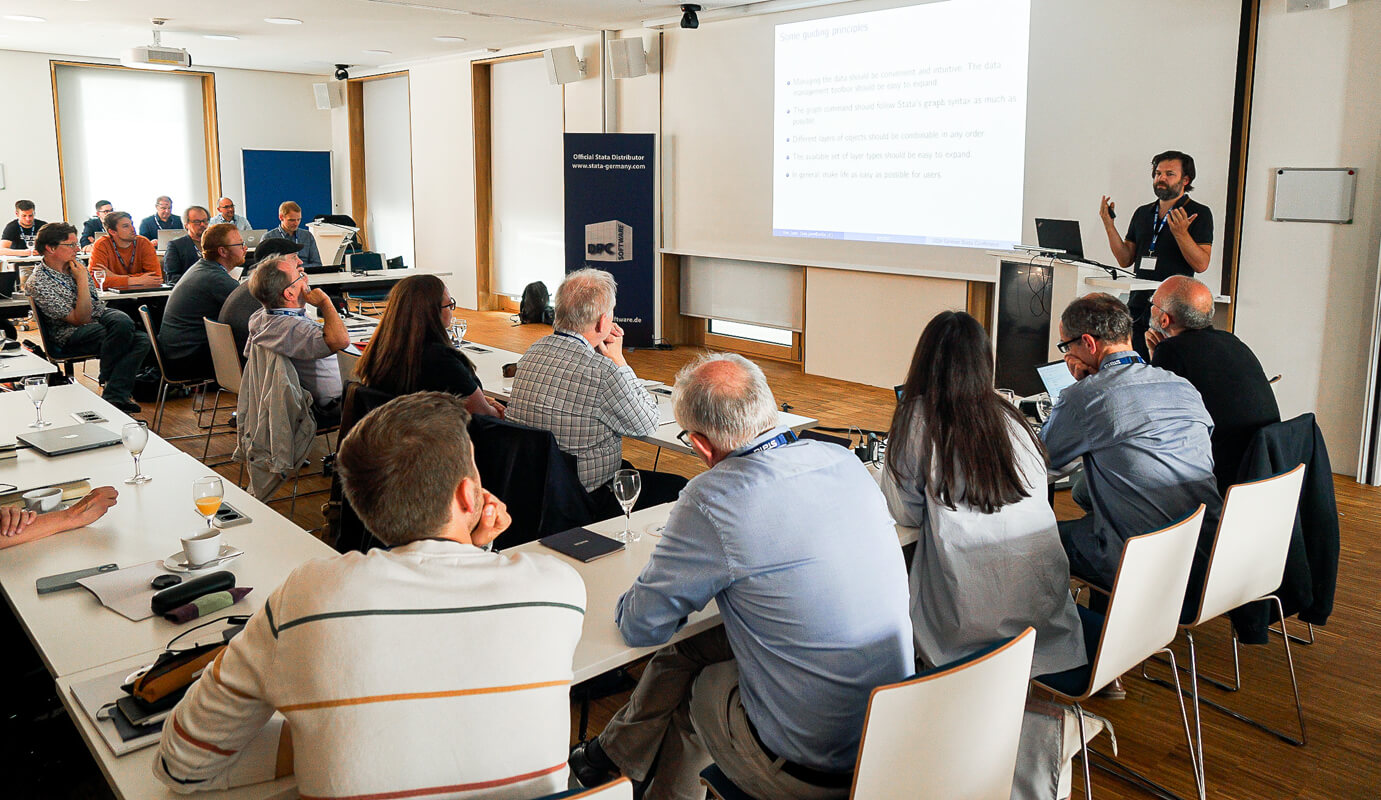
After that, Prof. Ben Jann (University of Bern, Switzerland) presented his very large ado ‚geoplot‘, which is able to draw maps in Stata based on standardized shape-files and other formats. Shape-files contain vector-data information and are widely available for any geographic entity. In combination with datafiles, the geoplot-command is able to generate map graphs with any available spatial data. Prof. Jann’s presentation addressed an audience beyond statistical experts and offers a lot of application possibilities across different disciplines.
A topic that has its origin in the replication crisis within Psychology is the question how to ensure reproducibility. This question has gained attention in all scientific disciplines, because increasing complexity of both, datasets and statistical methods, has led to a situation, which makes the reproduction of scientific results increasingly difficult. This issue challenges the scientific system as a whole, because of its central epistemological importance. Daniel Krähmer (Ludwig-Maximilian-University of Munich) presented his command ‚repreport‘, which – similar to a classical log-file – automatically compiles information during a running analysis in order to collect only the information necessary for reproduction of a study. This presentation started a pathway that MUST be continued and developed further, because it is of major importance for the integrity of any discipline’s research.
A similar direction is taken by the presentation of Maarten Buis, who developed a set of commands (‚mkproject‘ and ‚boilerplate‘) which aims at standardizing the process of analysis. This also relates to the reproduction problem, because increasing individualization of research processes do challenge the reproductivity of research, too.
The last presentation of the conference also touches a very general topic that is important for common researchers, namely the data structures in general, and the transfer between them. Daniel Schneider (Max-Planck-Institute for Demographic Research, Rostock) aimed at starting a discussion on how on could use Stata’s potential in this respect.
To sum up the topics of this year’s Stata Conference, it becomes apparent that there were many general than specific issues. Especially the reproduction issue is important for ANY research discipline and should be continued.
Report German Stata Conference 2024
Die diesjährige Deutsche Stata-Konferenz fand am 7. und 8. Juni am GESIS Leibniz-Institut für Sozialwissenschaften in Mannheim statt.
Prof. Reinhard Pollack, Leiter der Abteilung Daten und Gesellschaftsforschung, war Gastgeber der Konferenz, während das DPC-Team für die Organisation verantwortlich war. GESIS ist eine der größten Forschungsinstitutionen in Europa, die Dateninfrastrukturen in den Sozialwissenschaften bereitstellt und daher ein perfekter Partner für Stata. Prof. Johannes Giesecke (Humboldt Universität Berlin) und Prof. Ulrich Kohler (Universität Potsdam) bildeten das wissenschaftliche Komitee. Als Vertreter der Stata Corp. hatten wir die Freude, Kristin MacDonald und Chinh Nguyen als Gäste begrüßen zu dürfen. Das DPC-Team und die Konferenzteilnehmer haben die Gelegenheit genutzt, einige Fragen rund um Stata mit den Entwicklern persönlich zu diskutieren.
Am Donnerstag hatten wir einen sehr guten Vorkonferenz-Workshop zur Difference-in-Difference (DiD)-Modellen, in dem Felix Knauf von Science Po in Paris die neuesten und aktuellsten Entwicklungen dieser Methode vorstellte. Als Experte auf diesem Gebiet entwickelte er zusammen mit Kollegen eine Reihe von benutzerdefinierten ados, die er in seinem 7-stündigen Workshop detailliert erläuterte. Die Teilnehmer hatten die Möglichkeit, praktische Übungen durchzuführen und spezifische Fragen mit Felix im Detail zu diskutieren. Er erläuterte die theoretischen Grundlagen der Methode, verschiedene DiD-Ansätze und -Entwürfe sowie aktuelle Arbeiten, die die Methode weiterentwickeln. Felix stellte auch eine Reihe von webbasierten Ressourcen zur DiD-Schätzung zur Verfügung.
Die Konferenz begann am Freitag mit einer Präsentation von GESIS durch Prof. Pollack, gefolgt von der Keynote von Prof. Paul Lambert (University of Leicester und Karolinska Institutet Stockholm) zur Survivalanalyse (auch bekannt als Ereignisdatenanalyse). Er plädierte für flexible parametrische Survivalmodelle als Alternative zum „Goldstandard“ des Cox-proportional-Hazards-Modell. In diesem Zusammenhang stellte er sein benutzerdefiniertes ado „stpm3“ und eine Reihe von Tools zur Postestimation vor. Ebenfalls mit der Survivalanalyse verbunden war der zweite Vortrag von Prof. Harald Tauchmann (Friedrich-Alexander-Universität Erlangen-Nürnberg), in dem er seine selbstgeschriebenen ados ‚cfbinout‘ und ‚xtdhazard‘ vorstellte. Beide Vorträge repräsentieren die neuesten Diskussionen auf dem Gebiet der Überlebensanalyse.
Die letzten beiden Vorträge vor der Mittagspause wurden von Peter Krause (DIW Berlin) über multidimensionales Well-Being, Deprivation und Ungleichheit und von Wolfgang Langer (Martin-Luther-Universität Halle-Wittenberg) über Modellanpassungsstatistiken von logistischen Regressionsmodellen gehalten. Er entwickelte ein eigenes Programm, mit dem verschiedene Pseudo-r-Quadrat-Statistiken berechnet werden können, um die Anpassungsgüte dieser nichtlinearen Modelle zu beurteilen. Auf diese Präsentation folgte eine lebhafte und kontroverse Diskussion über die Gültigkeit der verschiedenen Maßstäbe, da man sich hier noch nicht auf einen allgemein akzeptierten Standard geeinigt hat. Das von einem Nutzer geschriebene ado ‚fit_cmlogit‘ trägt zur laufenden Debatte über die Bewertung der Anpassungsgüte von logistischen Regressionsmodellen bei.
Nach der Mittagspause stellte Kristin Macdonald von der Stata Corp. die neuen Stata-Befehle zur Anpassung von Tabellen vor, nämlich den erneuerten table-Befehl, etable und dtable. Diese sind Wrapper für die neue und sehr umfangreiche collect-Suite, die es erlaubt, jede denkbare statistische Tabelle anzulegen, die nach individuellen Bedürfnissen modifiziert und in MS Word, Excel, HTML, LaTeX oder pdf-Format exportiert werden kann. Der Export von Tabellen aus Stata in andere Formate war viele Jahre lang ein Problem und hat zu einer Reihe von benutzergeschriebenen ados geführt, wie z.B. estab oder estout. Die Implementierung der recht komplexen collect-Suite und der leichter zugänglichen Wrapper table, dtable und etable hat eine Lücke im Befehlsuniversum von Stata geschlossen und wird die Erstellung und den Export von Tabellen aus Stata in Textverarbeitungsprogramme deutlich erleichtern.
Danach stellte Prof. Ben Jann (Universität Bern, Schweiz) sein sehr umfangreiches ado ‚geoplot‘ vor, mit dem man in Stata Karten auf der Basis von standardisierten Shape-Files und anderen Formaten zeichnen kann. Shape-Files enthalten Vektordaten-Informationen und sind für jede geographische Einheit weithin verfügbar. In Kombination mit Datendateien ist der geoplot-Befehl in der Lage, Kartengrafiken mit allen verfügbaren räumlichen Daten zu erzeugen. Der Vortrag von Prof. Jann richtete sich nicht nur an Statistikexperten, sondern bietet eine Vielzahl von Anwendungsmöglichkeiten über verschiedene Disziplinen hinweg.
Ein Thema, das seinen Ursprung in der Reproduktionskrise in der Psychologie hat, ist die Frage, wie man Reproduzierbarkeit sicherstellen kann. Diese Frage hat in allen wissenschaftlichen Disziplinen an Bedeutung gewonnen, da die zunehmende Komplexität sowohl der Datensätze als auch der statistischen Methoden zu einer Situation führt, die die Reproduktion wissenschaftlicher Ergebnisse immer schwieriger macht. Diese Frage stellt aufgrund ihrer zentralen erkenntnistheoretischen Bedeutung eine Herausforderung für das Wissenschaftssystem als Ganzes dar. Daniel Krähmer (Ludwig-Maximilians-Universität München) stellte sein Kommando ‚repreport‘ vor, das – ähnlich wie ein klassisches Log-File – automatisch Informationen während einer laufenden Analyse zusammenstellt, um nur die für die Reproduktion einer Studie notwendigen Informationen zu sammeln. Mit diesem Vortrag wurde ein Weg eingeschlagen, der unbedingt fortgesetzt und weiterentwickelt werden muss, da er für die Integrität der Forschung in jeder Disziplin von großer Bedeutung ist.
In eine ähnliche Richtung geht die Präsentation von Maarten Buis, der eine Reihe von Befehlen („mkproject“ und „boilerplate“) entwickelt hat, die auf die Standardisierung des Analyseprozesses abzielen. Dies betrifft auch die Reproduktionsproblematik, denn die zunehmende Individualisierung der Forschungsprozesse stellt ebenfalls die Reproduzierbarkeit der Forschung in Frage.
Der letzte Vortrag der Konferenz berührt ebenfalls ein sehr allgemeines Thema, das für den allgemeinen Forscher wichtig ist, nämlich die Datenstrukturen im Allgemeinen und den Transfer zwischen ihnen. Daniel Schneider (Max-Planck-Institut für demografische Forschung, Rostock) versuchte, eine Diskussion darüber anzustoßen, wie man das Potenzial von Stata in dieser Hinsicht nutzen kann.
Fasst man die Themen der diesjährigen Stata-Konferenz zusammen, so wird deutlich, dass es mehr allgemeine als spezifische Themen gab. Insbesondere das Thema Reproduktion ist für JEDE Forschungsdisziplin wichtig und sollte weiter verfolgt werden.

KeyNote Speaker
 Professor Paul C Lambert
Professor of Biostatistics
Paul Lambert is Professor of Biostatistics at the University of Leicester, UK and Karolinska Institute, Sweden. His main research interests is survival analysis methods in epidemiology, specializing in methods in population-based cancer studies. He has developed various Stata commands, mainly in the area of survival analysis. (https://pclambert.net/#software)
Workshop leader
Felix Knau
Felix studied both a bachelor’s and a master’s degree in economics at the University of Mannheim and successfully completed them last summer. Meanwhile, he also worked there as a research assistant and at the IAB in Nuremberg as an intern and later research assistant. Since September 2023 he has been working as a full-time research assistant for Professor Clement de Chaisemartin at Sciences Po. There he mainly works on the implementation of various (DID) estimation methods for causal treatment effects as Stata packages as well as the „user support“ for the corresponding commands.
Program
Recent developments in the fitting and assessment of flexible parametric survival models
Paul Lambert (University of Leicester, UK and Karolinska Institutet, Sweden)
Abstract: Flexible parametric survival models are an alternative to the Cox proportional hazards model and more standard parametric models for the modelling of survival (time-to-event) data. They are flexible in that spline functions are used to model the baseline and potentially complex time-dependent effects. I will give a brief overview of the models and the advantages over the Cox model. However, I will concentrate on some recent developments. This will include the motivation for developing a new command to fit the models (stpm3), which makes it much simpler to fit more complex models with non-linear functions, non-proportional hazards and interactions and simplifies and extends postestimation predictions, particularly marginal (standardized) predictions. I will also describe some new postestimation tools that help in the evaluation of model fit and validation in prognostic models.
cfbinout and xtdhazard: Control-Function Estimation of Binary-Outcome Models and the Discrete-Time Hazard Model
Harald Tauchmann (FAU Erlangen-Nurenberg) and Elena Yurkevich (FAU Erlangen-Nurenberg)
Abstract: We introduce the new community-contributed Stata commands cfbinout and xtdhazard. The former generalizes ivprobit, twostep by allowing discrete endogenous regressors and different link functions than the normal link, specifically logit and cloglog. In terms of the underlying econometric theory, cfbinout is guided by Wooldridge (2015). In terms of the implementation in Stata and Mata, respectively, cfbinout follows Terza (2017). xtdhazard is essentially a wrapper for either cfbinout or alternatively ivregress 2sls. When calling ivregress 2sls, xtdhazard implements the linear first-differences (or higher-order differences) instrumental variables estimator suggested by Farbmacher & Tauchmann (2023) for dealing with time-invariant unobserved heterogeneity in the discrete-time hazard model. When calling cfbinout, xtdhazard implements—depending on the specified link function—several nonlinear counterparts of this estimator that are briefly discussed in the online supplement to Farbmacher & Tauchmann (2023). Using xtdhazard—rather than directly using ivregress 2sls, ivprobit, twostep, or cfbinout—simplifies the implementation of these estimators, as generating the numerous instruments required can be cumbersome, especially when using factor-variables syntax. In addition, xtdhazard performs several checks that may prevent ivregress 2sls and ivprobit, twostep, respectively, from failing and reports issues like perfect first-stage predictions. An (extended) replication of Cantoni (2012) illustrates the use of cfbinout and xtdhazard in applied empirical work.
- Cantoni, D. (2012). Adopting a new religion: The case of Protestantism in 16th century Germany, The Economic Journal 122, 502-531.
- Farbmacher, H. and Tauchmann, H. (2023). Linear fixed-effects estimation with nonrepeated outcomes, Econometric Reviews 42(8): 635–654.
- Terza, J. (2017). Two-stage residual inclusion estimation: A practitioners guide to Stata implementation, Stata Journal 17(4): 916–938.
- Wooldridge, J. M. (2015). Control function methods in applied econometrics, The Journal of Human Resources 50(2): 420–445.
Multi-dimensional well-being, deprivation, and inequality
Peter Krause (DIW Berlin, SOEP)
Abstract: The presentation offers a brief summary for a set of Stata programs for extended multidimensional applications on well-being, deprivation, and inequality. The first section illustrates the underlaying motivation by some empirical examples on decomposed multi- dimensional results. The second section on multi-dimensional well-being and deprivation measurement illustrates the conceptual background—based on the Alkire/Foster MPI framework (and CPI, N. Rippin)—which is also applied to well-being measurement, and extended by a parameter driven fixed-fuzzy approach—with several illustrations and further details on the options offered in the Stata deprivation and well-being programs. The third section on multi- dimensional inequalities refers to a multidimensional Gini-based row-first measurement framework with a special emphasize on multiple within- and between-group-inequalities—including conceptual extensions on horizontal between-group applications and further details on the options offered in the Stata inequality program. Section four summarizes and opens up for advice and discussion.
How to assess the fit of choice models with Stata?
Wolfgang Langer (Martin-Luther-University Halle-Wittenberg)
Abstract: McFadden developed the conditional multinomial logit model in 1974 using it for rational choice modeling. In 1993 Stata introduced it in version 3. In 2007 Stata extended this model to the asclogit or ascprobit being able to estimate the effects of alternative-specific and case-specific exogenous variables on the choice probability of the discrete alternatives. In 2021, Stata added the class of choice models extending it to random-effect (mixed) and panel models. As it stands, Stata only provides an post-estimation Wald chi-square test to assess the overall model. However, although McFadden developed an pseudo r-square to assess the fit of the conditonal logit model already in 1974, Stata still does not provide it even in version 18. Thus, I developed fit_cmlogit to calculate the McFadden pseudo r-square using a zero model with alternative-specific constants to correct the uneven distribution of alternatives. Furthermore, it calculates the corresponding Likelihood-Ratio-chi-square test which is more reliable / conservative as the Wald test. The program uses the formulas of Hensher & Johnson (1981) and Ben-Akiva & Lerman (1985) for the McFdden pseudo-r square to correct the number of exogenous variables and faced alternatives. Train (2003) discussed these characteristics of the McFadden pseudo r-square in detail. Additionally it calculates the log-likelihood-based pseudo r-squares developed by Maddala (1983, 1988), Cragg & Uhler (1970) and Aldrich & Nelson (1984). The latter uses the correction formula proposed by Veall & Zimmermann (1994). An empirical example of predicting voting behavior in the German federal election study of 1990 demonstrates the usefulness of the program to assess the fit of logit choice models with alternative-specific and case-specific exogenous variables.
- Aldrich, J.H. & Nelson, F.D. (1984): Linear probability, logit and probit models. Beverly Hills, CA: Sage
- Ben-Akiva, M. & Lerman, S.R. (1985): Discrete choice analysis: Theory and application to travel demand. Cambridge, MA: MIT Press
- Cragg, G. & Uhler, R. (1970): The demand of automobiles. Canadian Journal of Economics, 3, pp.386-406
- Hensher, D.A. & Johnson, L.W. (1981): Applied discrete choice modelling. London: Croom Helm/Wiley
- Domencich, T.A. & McFadden, D. (1975): Urban travel demand. A behavioral analysis. Amsterdam u. Oxford: North Holland Publishing Company
- Maddala, G.S. (1983): Limited-dependent and qualitative variables in econometrics. Cambridge, U.K.: Cambridge University Press
- Maddala, G.S. (1992² (1988)): Introduction to Econometrics. New York, N.Y.: Maxwell
- MacmillanMcFadden, D. (1974): Conditional logit analysis of qualitative choice behavior. In: Frontiers of econometrics. Ed. P. Zarembka,, pp. 105-142. New York: Academic Press
- McFadden, D. (1979): Quantitative methods for analysing travel behaviour of individuals: some recent developments. In: Hensher, D.A.& Stopher, P.R.: (eds): Behavioural travel modelling. London: Croom Helm, pp. 279-318
- Train, K.E. (2003): Discrete choice methods with Simulations. Cambridge, U.K.: Cambridge University Press
- Veall, M.R. & Zimmermann, K.F. (1994): Evaluating Pseudo-R2’s for binary probit models. Quality&Quantity, 28, pp. 151- 164
Customizable tables
Kristin MacDonald (StataCorp)
Abstract: Presenting results effectively is a crucial step in statistical analyses, and creating tables is an important part of this step. Whether you need to create a cross-tabulation, a Table 1 reporting summary statistics, a table of regression results, or a highly customized table of results returned by multiple Stata commands, the tables features introduced in Stata 17 and Stata 18 provide ease and flexibility for you to create, customize, and export your tables. In this presentation, I will demonstrate how to use the table, dtable, and etable commands to easily create a variety of tables. I will also show how to use the collect suite to build and customize tables and to create table styles with your favorite customizations that you can apply to any tables you create in the future. Finally, I will demonstrate how to export individual tables to Word, Excel, LaTeX, PDF, Markdown, and HTML and how to incorporate your tables into complete reports containing formatted text, graphs, and other Stata results.
geoplot: A new command to draw maps
Ben Jann (University of Bern)
Abstract: geoplot is a new command for drawing maps from shape files and other datasets. Multiple layers of elements such as regions, borders, lakes, roads, labels, and symbols can be freely combined and the look of elements (e.g. color) can be varied depending on the values of variables. Compared to previous solutions in Stata, geoplot provides more user convenience, more functionality, and more flexibility. In this talk I will introduce the basic components of the command and illustrate its use with examples.
repreport: Facilitating reproducible research in Stata
Daniel Krähmer Daniel Krähmer (Ludwig-Maximilians-Universität München)
In theory, Stata provides a stable computational environment and includes commands (i.e., version) that are specifically designed to ensure reproducibility. In practice, however, users often lack the time or the knowledge to exploit this potential. Insights from an ongoing research project on reproducibility in the social sciences show that computational reproducibility is regularly impeded by researchers being unaware what files (i.e., datasets, do-files), software components (i.e., ados), infrastructure (i.e., directories), and information (i.e., ReadMe files) is needed to enable reproduction. This presentation introduces the new Stata command repreport as a potential remedy. The command works like a log, with one key difference: Instead of logging the entire analysis, repreport extracts specific pieces of information pertinent to reproduction (e.g., names and locations of datasets, ados, etc.) and compiles them into a concise reproduction report. Furthermore, the command includes an option for generating a full-fledged reproduction package containing all components needed for push-button reproducibility. While repreport adds little value for researchers whose workflow is already perfectly reproducible, it constitutes a powerful tool for those who strive to make their research in Stata more reproducible at (almost) no additional cost.
mkproject and boilerplate: automate the beginning
Maarten Buis Maarten L. Buis (University of Konstanz)
There is usually a set of commands that are included in every .do file a person makes, like clear all or log using. What those commands are can differ from person to person, but most persons have such a standard set. Similarly, a project usually has a standard set of directories and files. Starting a new .do file or a new project thus involves a number of steps that could easily be automated. Automating has the advantage of reducing the amount of work you need to do. However, the more important advantage of automating the start of a .do file or project is that it makes it easier to maintain your own workflow: it is so easy to start „quick and dirty“ and promise to yourself that you will fix that „later“. If the start is automated, then you don’t need to fix it.
The mkproject command automates the beginning of a project. It comes with a set of templates I find useful. A template contains all the actions (like create sub-directories, create files, run other Stata commands) that mkproject will take when it creates a new project. Since everybody’s workflow is different, mkproject allows users to create their own template. Similarly, the boilerplate command creates a new .do file with boilerplate code in it. It comes with a set of templates, but the user can create their own.
This talk will illustrate the use of both mkproject and boilerpate and how to create your own templates.
Data structures in Stata
Daniel C. Schneider (Max Planck Institute for Demographic Research, Rostock)
This presentation starts out by enumerating and describing the main data structures in Stata (e.g., data sets / frames, matrices) and Mata (e.g., string and numeric matrices, objects like associative arrays). It analyzes ways in which data can be represented and coerced from one data container into another. After assessing the strengths and limitations of existing data containers, it muses on potential additions of new data structures and on enriching the functionality of existing data structures and their interplay. Moreover, data structures from other languages, such as Python lists, are described and examined for their potential introduction into Stata / Mata. The goal of the presentation is to stimulate a discussion among Stata users and developers about ways in which the capabilities of Stata’s data structures could be enhanced in order to ease and open up new possibilities for data management and analysis.
Open panel discussion with Stata developers
Abstract Contribute to the Stata community by sharing your feedback with StataCorp developers. From feature improvements to bug fixes and new ways to analyse data, we want to hear how Stata can be made better for you.
Workshop: DID Estimation Using Stata
Presenter: Felix Knau – SciencesPo, Paris – Department of Economics
Topics
- Short introduction DID und TWFE: How to apply those in Stata (simple examples, didregress, xtreg, reghdfe)
- What does TWFE identify (and when this may be problematic): brief introduction to twowayfeweights
- New DID methods robust to heterogeneous treatment effects: Static case, dynamic case (and maybe continuous treatment)
- More extensive (interactive) session on implementing corresponding commands: did_multiplegt_dyn, csdid, eventstudyinteract, did_imputation (with focus on did_multiplegt_dyn)
Organizers
Johannes Giesecke
Humboldt University Berlin
johannes.giesecke@hu-berlin.de
Ulrich Kohler
University of Potsdam
ulrich.kohler@uni-potsdam.de
Reinhard Pollak
GESIS
reinhard.pollak@gesis.org
Logistics Organizer
DPC Software GmbH (dpc-software.de), the distributor of Stata in several countries, including Germany, the Netherlands, Austria, the Czech Republic, and Hungary.
You can enroll by contacting Tim Prenzel by email or by writing or phoning.
Tim Prenzel
DPC Software GmbH
Phone: +49-212-224716 -15
E-Mail: Tim.Prenzel@dpc-software.de
